Introduction to Convolutional Neural Networks (CNN)
Convolutional Neural Networks (CNNs) are a specialized type of deep learning model particularly effective at processing data that has a grid-like topology, such as images. CNNs are composed of layers that automatically and adaptively learn spatial hierarchies of features, making them highly effective for image recognition, object detection, and similar tasks.
How to Train a CNN
Data Preparation: Collect and preprocess your dataset (e.g., normalizing images, resizing).
Model Architecture: Define a CNN architecture with convolutional, pooling, and fully connected layers.
Compilation: Set the loss function, optimizer, and metrics for training.
Training: Feed the training data into the network and adjust the model's parameters using backpropagation.
Evaluation: Assess the model's performance on validation or test datasets.
Inference: Use the trained model to make predictions on new data.
TensorFlow.js for CNNs and Training
TensorFlow.js is an open-source library that allows you to define, train, and run machine learning models directly in the browser and in Node.js environments. This makes it possible to create, train, and deploy CNNs using JavaScript, leveraging GPU acceleration where available.
Key Features of TensorFlow.js for CNNs
Layer API: Enables building sequential and functional neural network architectures, including convolutional layers like tf.layers.conv2d.
Training Support: Provides utilities to compile models, specify loss functions, optimizers (such as Adam), and fit models using model.fit().
GPU Acceleration: Uses WebGL for efficient computation in the browser.
Data Handling: Offers APIs for loading and manipulating image and tensor data.
With TensorFlow.js, you can train this network on image data directly in the browser, making deep learning accessible to web developers.
Libraries for Defining, Training, and Visualizing Models
Several JavaScript libraries are essential for building, training, and visualizing neural network models in the browser:
TensorFlow.js – Model Definition & Training: This is the main library for creating and training neural networks, including CNNs, directly in JavaScript.
tfjs-vis – Visualization: This library provides utilities to visualize model layers, training progress, metrics, and more, directly in the browser.
These libraries make it possible to build, train, and visualize deep learning models interactively within a web page.
Discussion: The MNIST Dataset and Labels
The MNIST dataset is a well-known collection of handwritten digits used for training and evaluating image processing systems. It consists of 28x28 pixel grayscale images of digits (0–9). Each image is paired with a label that indicates which digit it represents.
Images: Downloaded from mnist_images.png. This file is a large sprite image containing 70,000 digits (each of size 28x28), stacked vertically.
Labels: Downloaded from mnist_labels_uint8. This file contains one byte (an integer from 0 to 9) for each image in the sprite, describing which digit appears in each image.
Before using this data in a model, the images and labels must be extracted and organized. Each image will be converted into a flat array of pixel values (normalized between 0 and 1), and each label will be stored as an integer. The cleaned dataset is made easily accessible in the browser as cleanedData for further experiments.
Visualizing the Cleaned MNIST Dataset
After loading and preprocessing the MNIST data, it’s helpful to visualize some samples to confirm that the images and labels are correct. Below, you can display a selection of random handwritten digit images from cleanedData along with their corresponding labels.
Splitting the Dataset into Training and Testing Sets
Before building or evaluating a machine learning model, it’s important to split the dataset into two separate parts: a training set (used to train the model) and a testing set (used to evaluate model performance on unseen data). A common practice is to use 80% of the data for training and 20% for testing. This helps ensure fair and unbiased evaluation of your model.
Click the button below to perform the split. After splitting, you can access the sets with trainingSet and testingSet in your scripts.
Defining a Convolutional Neural Network (CNN) Model
Convolutional Neural Networks (CNNs) are specialized for processing images. With the button below, you can programmatically define a simple CNN architecture in JavaScript, ready for training on the MNIST dataset. After creation, the layer configuration will be displayed.
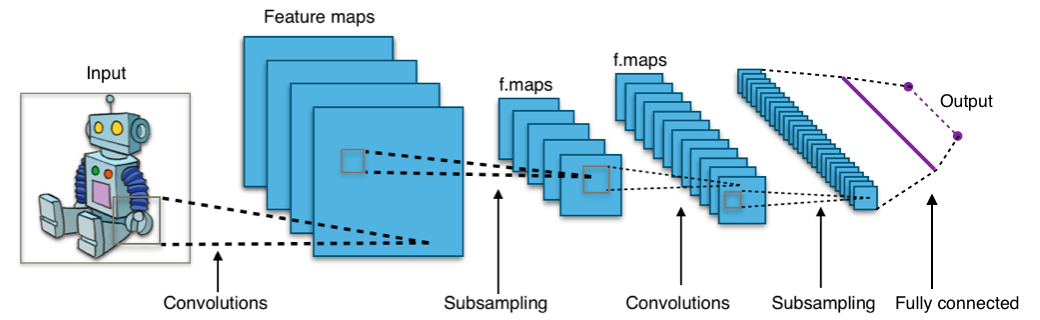
Understanding the CNN Architecture
A Convolutional Neural Network (CNN) uses a series of layers to extract patterns from image data and perform classification. Here’s a visual explanation of how it works:
Input layer: Takes a 28x28 grayscale image.
Convolutional layers: Scan the image to extract local features (edges, blobs, etc.).
Pooling layers: Reduce the spatial size, focusing on the most important features.
Flatten layer: Converts the 2D feature maps into a 1D vector.
Dense (fully connected) layers: Combine the extracted features to make the final decision.
Output layer: Uses softmax to predict the probability of each digit (0-9).
In this animation, you can see how filters slide across the image, producing feature maps that capture patterns useful for recognizing digits.
Training the CNN Model
After defining and understanding your CNN model, the next step is to train it using your training dataset. Training involves feeding your model many labeled examples so it can learn to recognize digit patterns. As training progresses, you can monitor the accuracy and loss to see how well the model is learning.
Understanding the Confusion Matrix
A confusion matrix is a table that visualizes the performance of a classification model by showing how many predictions were correct and where errors occurred. Each row corresponds to the actual class, and each column to the predicted class. The diagonal values represent correct predictions, while off-diagonal values indicate misclassifications.
High diagonal values mean good performance.
Non-zero off-diagonal values show specific mistakes (e.g., confusing '3' with '5').
 In this animation, you can see how filters slide across the image, producing feature maps that capture patterns useful for recognizing digits.