Training a Convolutional Neural Network (CNN) in the Browser
Introduction: What is a Convolutional Neural Network?
Convolutional Neural Networks (CNNs) are a class of deep learning models specialized for processing grid-like data, such as images.
Introduced in the late 1990s, they have become the standard for image classification, object detection, and other computer vision tasks.
Convolutional Layers: Extract features from input images using filters.
Pooling Layers: Reduce the spatial dimensions, helping make the representations smaller and more manageable.
Fully Connected Layers: Perform high-level reasoning and output predictions.
The main advantage of CNNs is their ability to automatically and adaptively learn spatial hierarchies of features from input images.
How to Train a CNN
Prepare the Dataset: Gather and preprocess images, often normalizing and resizing them.
Design the Model: Stack convolutional, pooling, and dense layers to define the network architecture.
Compile the Model: Specify a loss function, optimizer, and metrics for evaluation.
Train: Feed the network batches of images and labels, allowing it to optimize its filters and weights through backpropagation.
Evaluate & Improve: Test the model on unseen data and tune hyperparameters or architecture as needed.
Training involves letting the model learn patterns in the data by minimizing the loss function through iterative updates.
What Does a CNN Look Like?
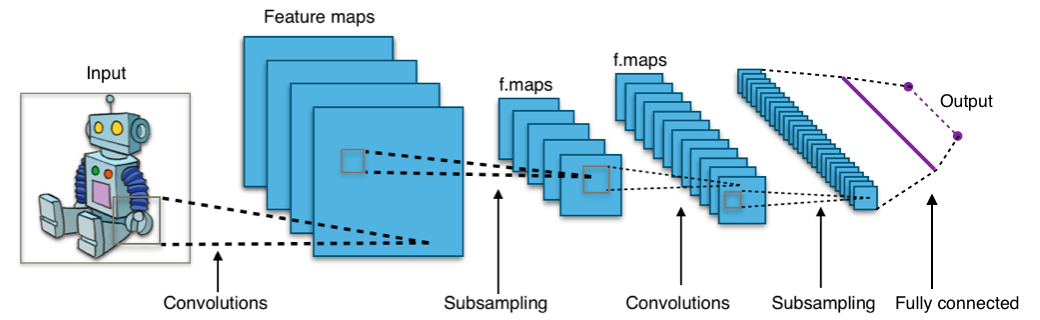
A CNN is made of several layers, each containing many "neurons" (small computational units). The main types of layers are convolutional, pooling, and dense (fully connected) layers.
Diagram: Example flow in a simple CNN. Each layer transforms the image into a new set of features, ending in an output prediction.
Easy Example: Recognizing Handwritten Digits
Imagine you want your computer to recognize whether a picture shows the digit “3” or “7”. You show it thousands of examples of hand-drawn numbers.
The input layer takes the image as a grid of pixels.
Convolution layers look for small patterns like edges or curves.
Pooling layers simplify the information, focusing on the most important features.
The fully connected/output layer combines this information to decide, for example, “this is likely a 3”.
The network learns by adjusting its inner connections every time it makes a mistake, until it gets very good at telling 3’s and 7’s apart—even if it’s never seen your handwriting before!
TensorFlow.js: CNNs in JavaScript
TensorFlow.js is a JavaScript library for training and running machine learning models in the browser and on Node.js.
Easy Prototyping: Build, train, and deploy models directly in the browser without server-side code.
GPU Acceleration: Leverage WebGL for fast computation.
CNN Support: Offers high-level layers like tf.layers.conv2d, tf.layers.maxPooling2d, and more for constructing CNNs.
Data Handling: Built-in utilities for handling images and tensors, and even loading pre-made datasets such as MNIST.
With TensorFlow.js, you can experiment and visualize neural networks directly in the browser.
Libraries for Building, Training, and Visualizing Neural Networks
Several JavaScript libraries make it possible to define, train, and visualize neural network models directly in your web browser:
TensorFlow.js
(docs):
The main library for machine learning in JavaScript. It supports both model definition and training.
Keras.js
(docs):
Enables running pre-trained Keras models in the browser.
TensorFlow.js Vis
(docs):
Provides visualization tools for model training and evaluation in the browser.
These tools allow you to build, train, and monitor neural networks interactively and visually on the client side.
About the MNIST Dataset and Labels
The MNIST dataset consists of grayscale images of handwritten digits (0-9), commonly used for training and testing image classification models. The images are stored in a PNG file, where each digit is a 28x28 pixel square. Each image has an associated label, which indicates the digit it represents.
Images:mnist_images.png
— Contains thousands of handwritten digit images in a single large grid.
Labels:mnist_labels_uint8
— A binary file where each value corresponds to the label (0-9) of an image.
Together, these files provide the input data (images) and the ground-truth answers (labels) for training and evaluating neural network models.
Visualizing the Cleaned MNIST Dataset
Once the MNIST dataset is loaded, it can be helpful to visualize some sample images with their labels. This allows you to verify that the data was loaded correctly and to better understand the nature of the data your neural network will process.
Splitting the Dataset: Training and Testing Sets
To evaluate machine learning models fairly, we divide the dataset into two parts: training and testing. The training set is used to teach the model, while the testing set is reserved for checking performance on unseen data. A typical split is 80% training and 20% testing.
Defining a Convolutional Neural Network (CNN)
Convolutional Neural Networks (CNNs) are highly effective for image recognition tasks like MNIST digit classification.
Let's define a simple CNN model using TensorFlow.js. Click the button below to create the model and see its layer structure.
What Is a Convolutional Neural Network?
A CNN processes images step-by-step:
Convolutional Layers: Detect features (like edges and shapes) by sliding filters over the image.
Pooling Layers: Reduce image size while keeping key information, making the network faster and more robust.
Flatten & Dense Layers: Combine detected features to predict the digit class (0–9).
CNNs are the backbone of modern image recognition systems, automatically learning which features matter most for the task.
Now that we have split our dataset and defined a CNN model, it's time to train the model using the training set.
Training means letting the model learn the relationship between input images and their correct labels by adjusting its internal parameters.
Click the Train Model button below to begin training.
The process will run for several epochs (full passes over the training data), showing accuracy and loss for each epoch.
A chart below will update to show your model's progress visually.
Testing (Evaluating) the CNN Model
After training, we need to test our model on unseen data to measure how well it generalizes. This is called model evaluation.
We use the testing set (not used in training) and calculate metrics such as accuracy and loss.
Click the Test Model button below to evaluate the CNN on the test dataset.
The chart will show loss and accuracy for each test batch.
Final results will be displayed once testing is complete.
Understanding the Confusion Matrix
A confusion matrix is a table used to evaluate the performance of a classification model. Each row of the matrix represents the instances of an actual class, while each column represents the instances of a predicted class.
The diagonal cells show the number of correct predictions for each class (where the predicted label matches the actual label).
Off-diagonal cells show where the model made mistakes (misclassifications), indicating which classes were confused by the model.
The confusion matrix provides deeper insight into how your model performs on each class, beyond just overall accuracy.